Worse performance for smaller problem
AnsweredHi! I am using Gurobi to solve the MaxCut problem on a particular class of graphs. Maxcut is a maximization problem defined on graphs, where each vertex is a binary variable and each edge is a cost function term. Number of vertices in graph is its size N. I use only 3-regular graphs of different sizes. The cost function is quadratic with 1.5*N terms, and each variable participates in exactly 3 terms.
I observe strange behavior of gurobi optimization for large-sized problems. At some size N, increasing problem size improves performance, despite the problem being more complex. The optimality gap between bounds drops faster for larger N.
For instance, N1 = 7600 and N2 = 10000 and 100 seconds time gaps are 0.17 and 0.11 respectively. This behavior is observed in most of random instances of the problem. I published a jupyter notebook in colab for more detailed explanation.
I also did an experiment with 30 random graphs and plotted gap vs time for them.
You can see that for N=7600 at t=500 seconds half of problems have gap>0.16, while for N=1000 at same time half of graphs have gap<0.085. In general, looks like Gurobi finds good solutions much faster for N=10000 than N=7600
Is there any explanation to this behavior? Does Gurobi switch heuristics internally depending on the problem size?
-
Official comment

-
Gurobi Staff
This post is more than three years old. Some information may not be up to date. For current information, please check the Gurobi Documentation or Knowledge Base. If you need more help, please create a new post in the community forum. Or why not try our AI Gurobot?. -
-

-
Thanks for the nice code example and graphs. Yes, problem size impacts a lot of different decisions Gurobi makes.
Is there a reason you are running your tests with Threads=1? The extra threads may help a lot on these models, especially for finding new incumbent solutions at the root node. I expect using the default value of the Threads parameter would resolve some of the performance difference you are seeing.
Additionally, you could try the following parameters:
- Symmetry=0 disables symmetry detection. In the log file for the N=7600 model, Gurobi spends the entire solve (100 seconds) at the root node. This time may be spent looking for symmetries in the model, which could be particularly damaging to performance when limiting Gurobi to a single thread.
- PreQLinearize controls how/if Gurobi linearizes the quadratic objective. Gurobi opts for a "strong" reformulation on both of these models (PreQLinearize=1). Surprisingly, PreQLinearize=0 seems promising in some quick tests I ran using your code. You could also try PreQLinearize=2, which tells Gurobi to build a compact reformulation of the quadratic objective.
0 -
-

Hi Eli! Thanks for your reply.
I run gurobi mostly to time its performance for different-sized problems. I solve MaxCut on a multitude of different graphs and parallelize over them, such that each thread on my server runs optimization for a single graph. Let's say I have 50 cores and start to optimize 50 graphs in parallel. If gurobi itself runs in parallel, it will over-load the cores and increase timings. However, I might run 25 graphs in parallel and give gurobi 2 threads.
In general, I don't want the parallelization of gurobi to influence the timings for each individual problem.
I'll try the changing the parameters you mentioned and will get back to you with results!0 -
-

-
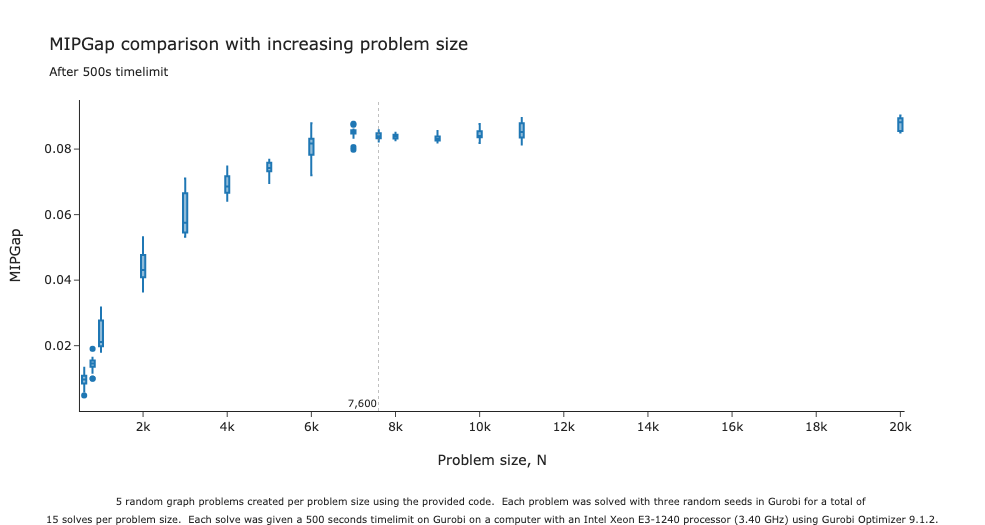
Eli's suggestions are the right way to go to improve performance overall. But, out of curiosity, I did some additional digging using the code you provided to better understand the performance profile with respect to problem size.
I found that if you expand the range of problem sizes tested, performance decreases with increasing problem size as you expected. However, the performance decreases seem to level off when the problem size, N, exceeds five or six thousand. You can see this in the box plot provided below.
 0
0 -
-
Hi Alison! Thank you for the plot.
I run Gurobi with these parameters: {'Symmetry': 0, 'PreQLinearize': 2} and found that for them the saturation point is a bit different.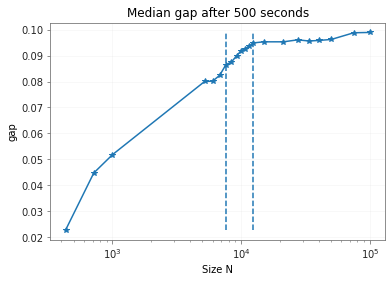
The plot was done using 30 random 3-regular graphs. The first vertical line is N=7600, the second is N=12400.
I chose PreQLinearize=2 because for PreQLinearize=0 gurobi was spending a lot of time in some intermediary state before starting to explore MIP nodes. For Symmetry=0, PreQLinearize=2 the solution is a bit better, but the strange behavior is still there, albeit for different N.
Here's a plot of time to reach a particular gap vs N for different gaps.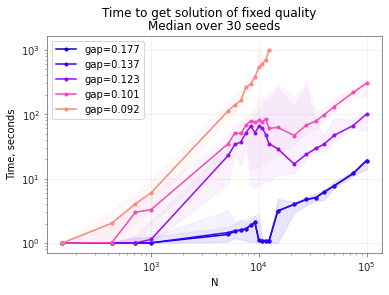
You can see that it's easier to get a gap of 0.123 for N~20k than for N=10k. Here's the analogous plot for gap vs time for the sizes in question:
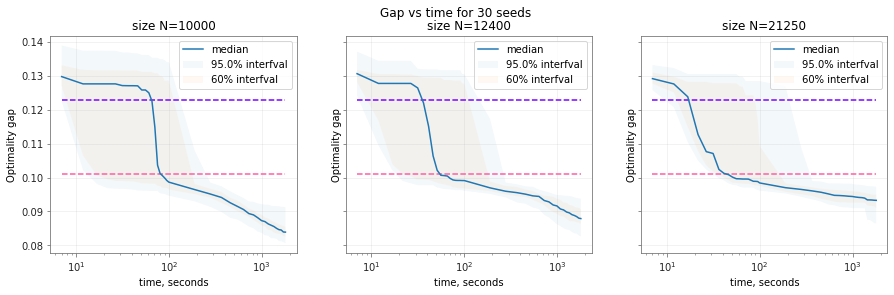 The horizontal lines correspond to gap=0.123 and 0.101 to reference with the previous plot.
What is also interesting is that all of the sizes have this sharp drop in gap in the gap vs time plot, and then a gradual descent. It's the time at which this drop occurs that becomes smaller vs N for N~10k-20k0 -
Post is closed for comments.
Comments
5 comments